In today’s dynamic and fast-paced business environment, decisions are no longer made in boardrooms based on gut feelings but rather by dashboards and insightful metrics. Analytics, the art of transforming raw data into actionable intelligence, has become the cornerstone redefining how modern industries operate, innovate, and thrive. From healthcare to customer experiences, gaming to market trends, data is the lifeblood driving informed decisions and propelling success.
So, where does your data-driven journey begin? It starts with building a sturdy foundation – a basic analytics stack that serves as the backbone for unlocking powerful insights. This blog gives you a high level insight into setting up analytics infrastructure.
Essentials of analytics Infrastructure
Central Gathering Place
A central gathering place, or data warehouse, is a specialized type of database designed for efficiently storing, managing, and analyzing large volumes of structured and sometimes unstructured data from various sources. The primary goal of a data warehouse is to provide a centralized and unified view of an organization’s data, facilitating easier extraction of valuable insights for decision-makers.
Data Transformation
The raw data stored in the warehouse requires refinement for effective use in analytical applications. Processed data is then modeled to extract features. To delve deeper into data modeling, further information can be found here
Data Visualization and Insights
After cleaning and preparing the data, the subsequent step involves creating visualizations to generate insights. Beautiful visualizations can be crafted using software such as Tableau, PowerBI, or Holistics Dashboards. More details about visualization tools are available here.
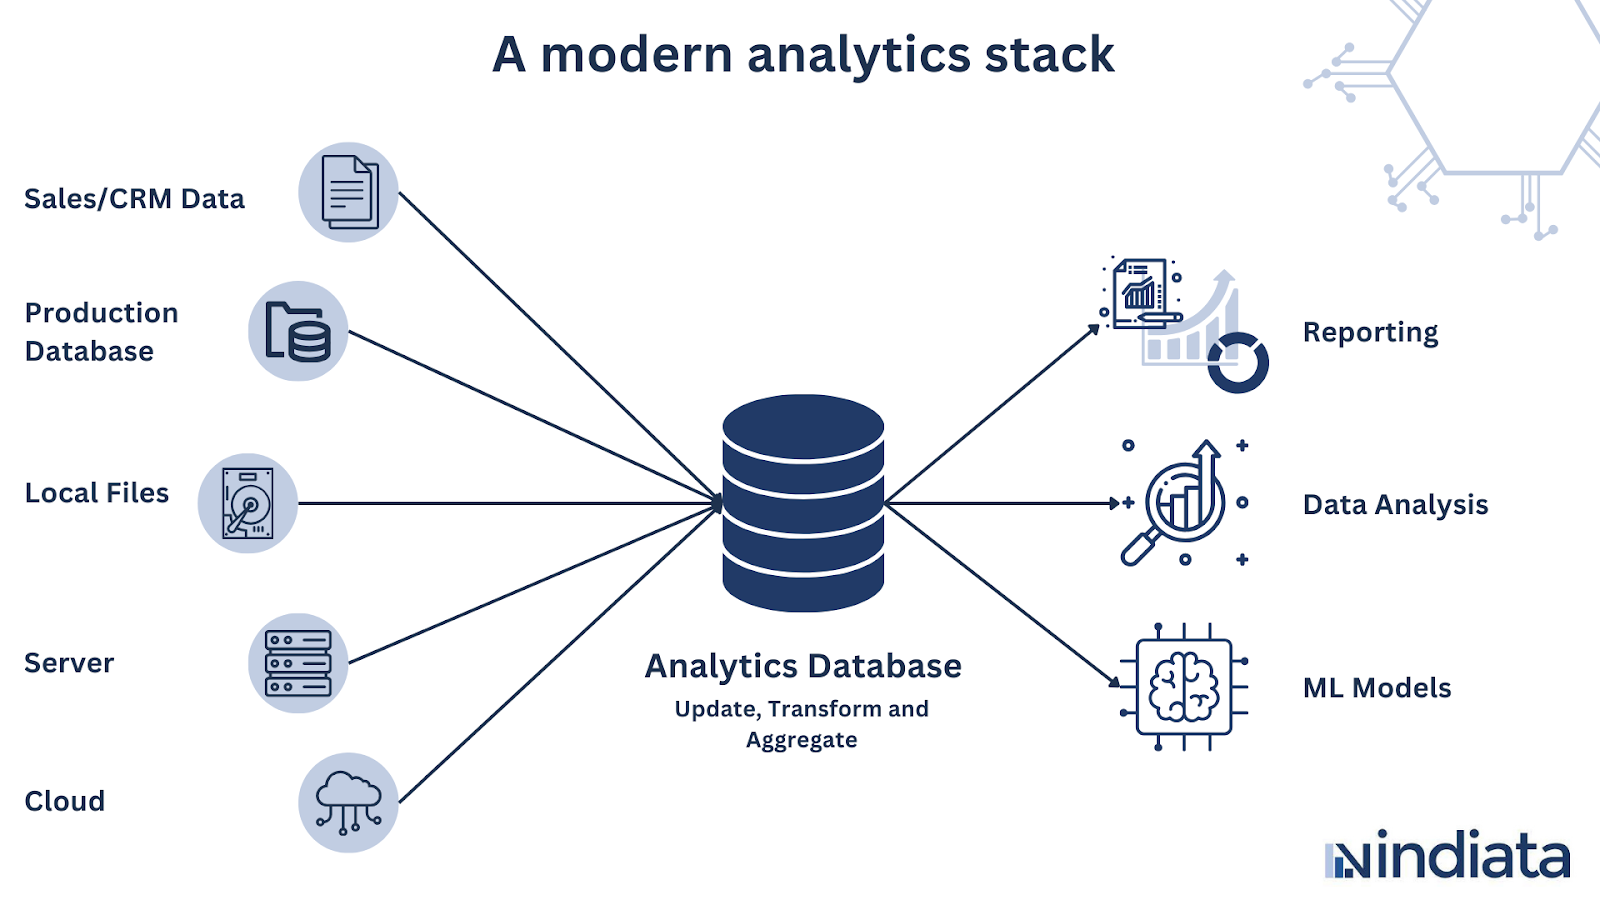
Let us understand how a modern analytical stack can be built upon the core components of analytical infrastructure.
A Modern Analytical Stack
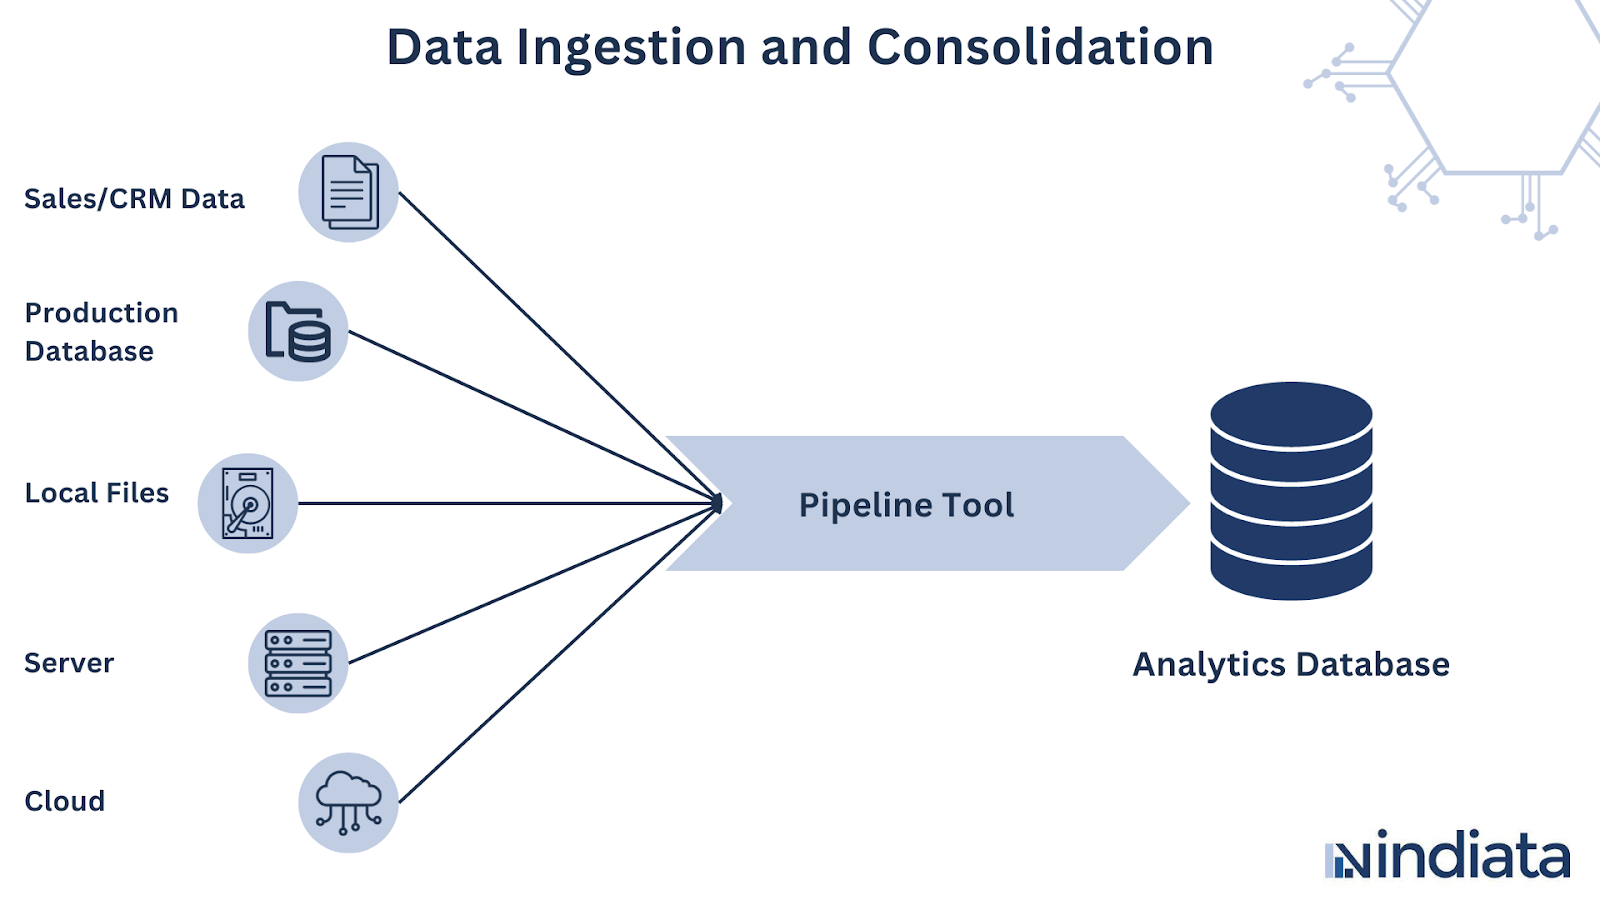
Data Ingestion and Consolidation
Data ingestion is the process of loading raw source data into a central database. The tools used for loading data are known as data pipelines. Data pipelines allow you to integrate data from different sources. This process is sometimes referred to as ETL (Extract, Transform, Load) in the analytics landscape. ETL involves combining data from multiple sources into a central repository called a data warehouse. A more modern approach that has emerged in recent years is known as ELT (Extract-Load-Transform). You can learn more about it here.
Consolidating data is important because it makes it easier to work with. We recommend using an analytical database as your central staging location. Imagine a central vault where all your raw data from different sources, such as your CRM, app, and marketing platforms, comes together. This is where the data warehouse comes into play. In addition to consolidating information from various sources within an organization, data warehouses have many benefits. Firstly, they help your organization maintain a single source of truth. Secondly, it becomes easier to query data from different sources to establish models and create relevant KPIs for tracking organizational growth. Lastly, data warehouses are structured to support analytical queries and reporting. You can learn more about data warehouses here. It’s important to note that the data ingested into the data warehouse may not be in the most usable format and may require processing.
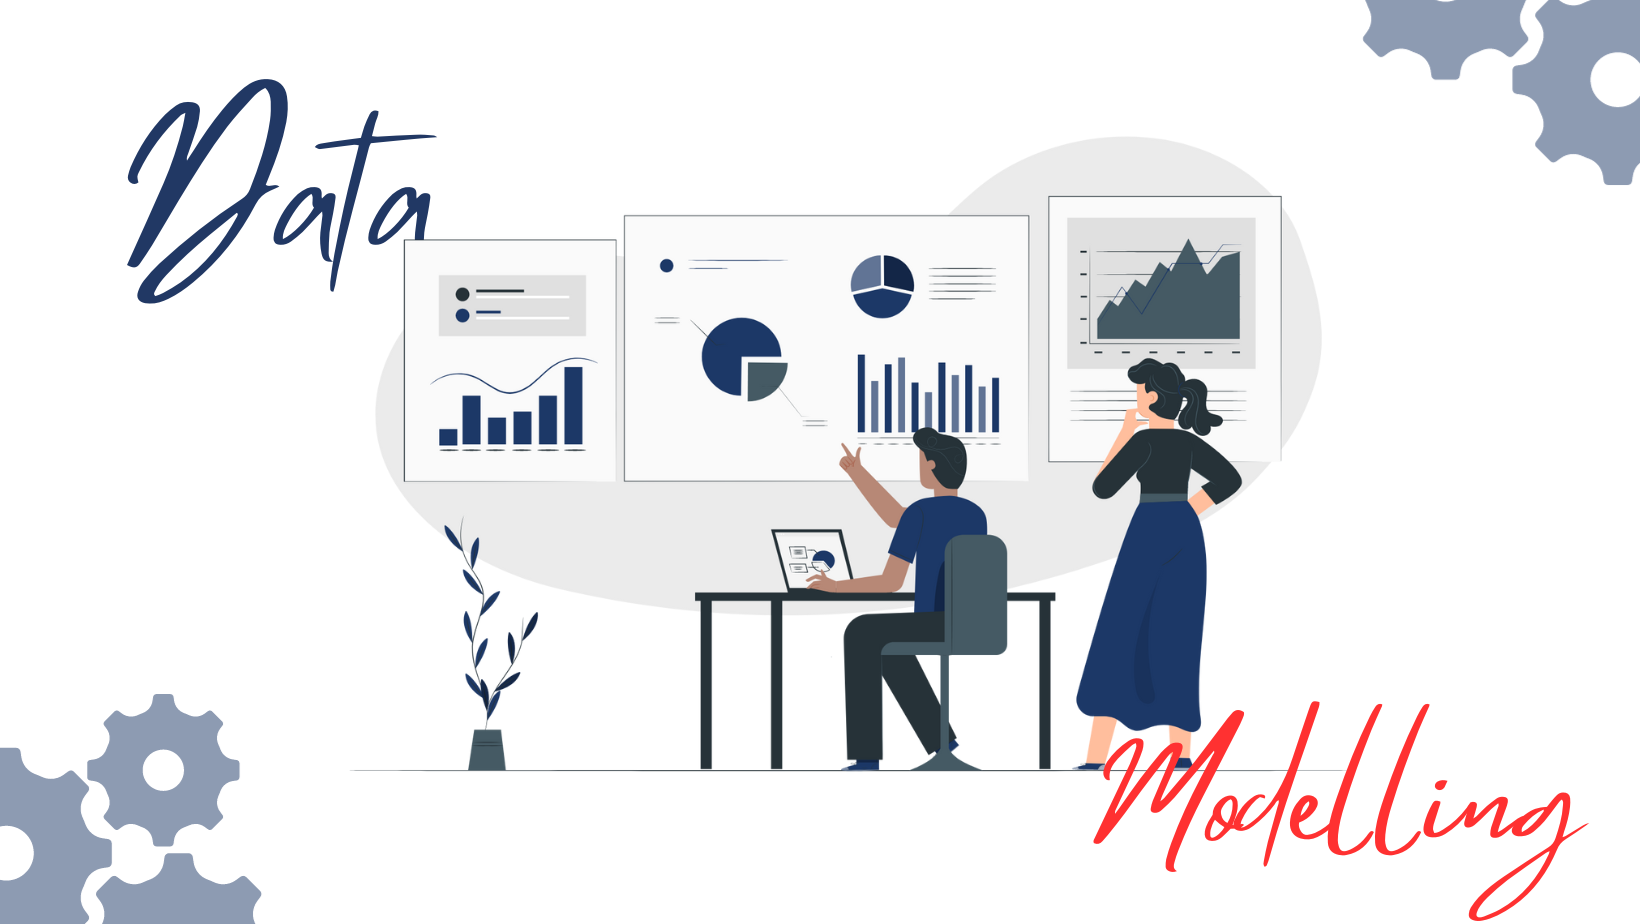
Data Transformation and Modeling
The data that is stored in a data warehouse may not be useful in its raw form. For it to be appropriate for analytical purposes, it needs to undergo a transformation process.
Data transformation consists of two vital aspects: data cleaning and data modeling. Data cleaning is the initial stage, which focuses on improving uniformity and consistency within a dataset. This process involves rectifying, removing, or addressing issues such as incorrect, corrupted, improperly formatted, duplicate, or incomplete data. The primary goal of data cleaning is to ensure that the dataset is reliable and has integrity, providing a foundation for accurate analysis and interpretation.
After data cleaning, the next aspect of data transformation is data modeling. This phase applies business logic, formulas, and structures to the refined dataset. It goes beyond rectifying errors to imbue the data with meaningful insights, facilitating its interpretation and utilization in decision-making processes. Data modeling plays a pivotal role in transforming raw information into a coherent and interpretable framework, increasing the dataset’s usability and contributing to the creation of Key Performance Indicators (KPIs) and charts. Learn more about data modelling over here.
Together, data cleaning and modeling form a comprehensive approach to transforming raw data into a valuable resource for informed decision-making within the business landscape.
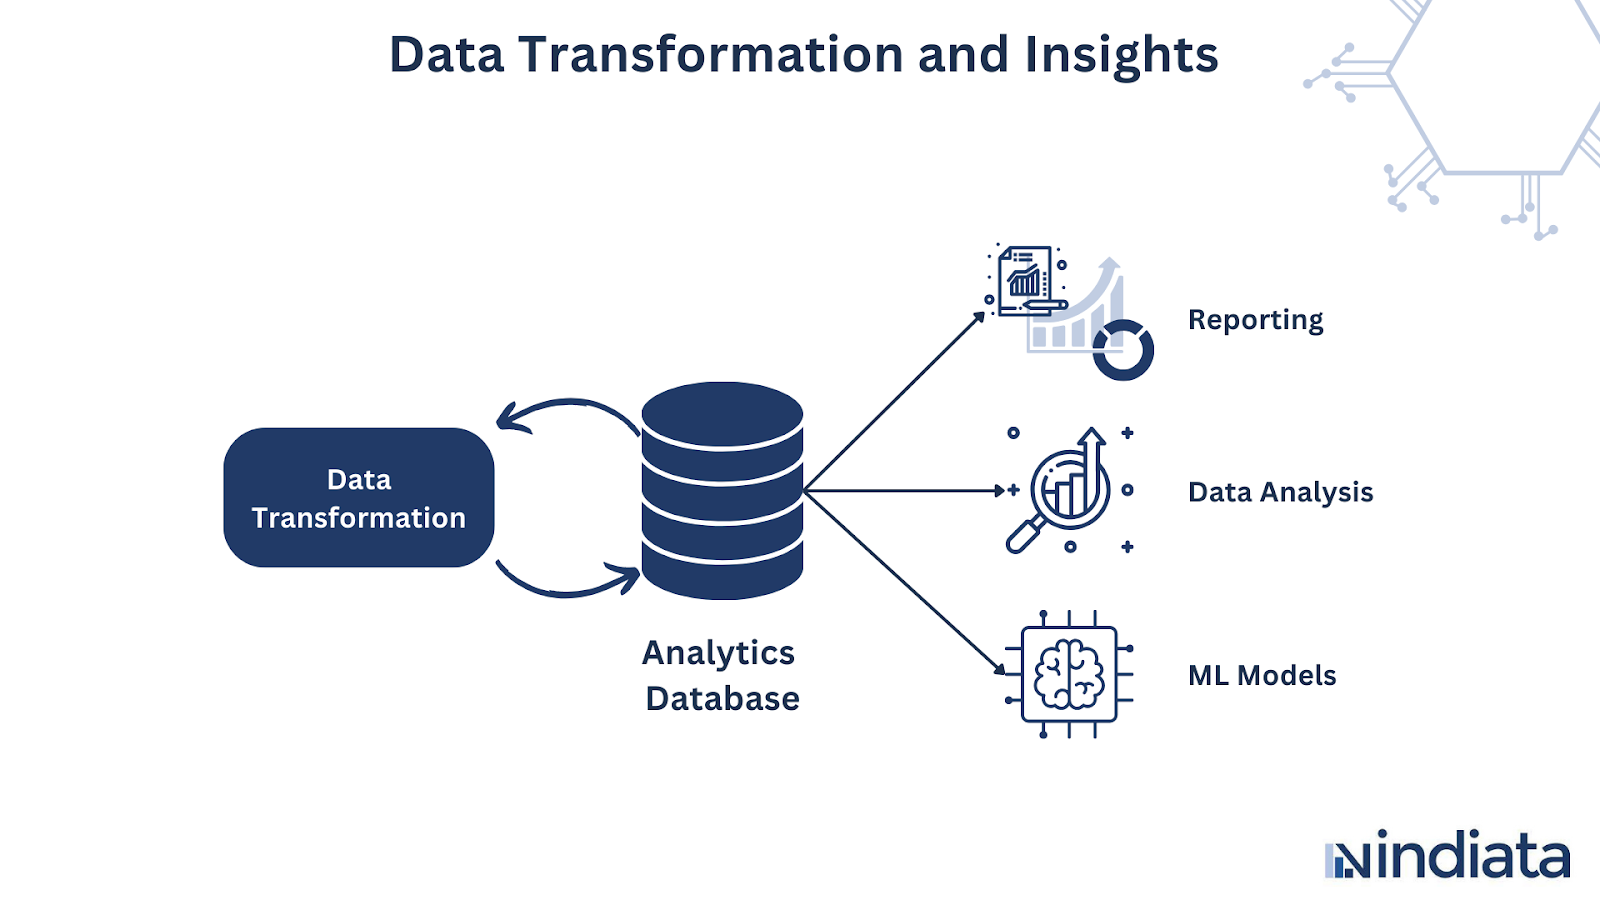
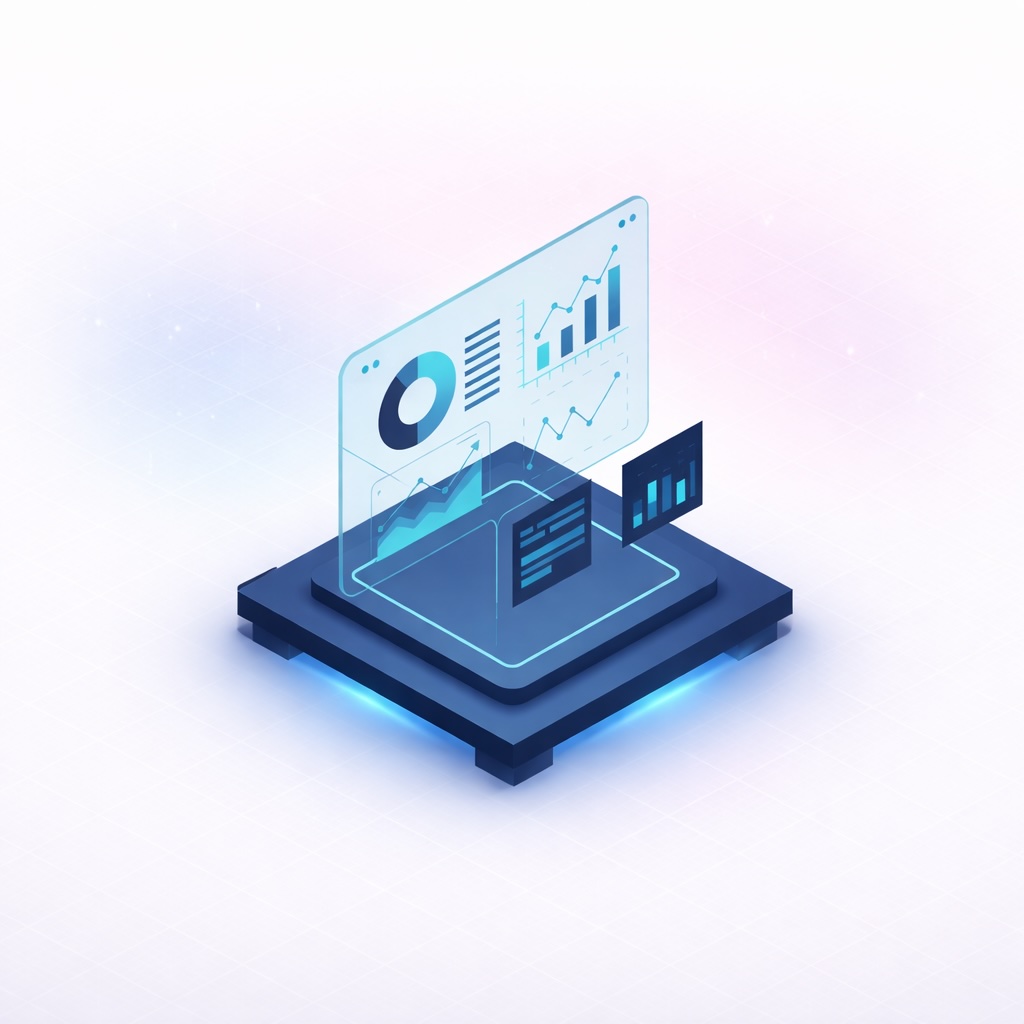
Insights and Action
After cleaning and modeling your data, the next step is to showcase it through reporting and visualization tools such as dashboards and interactive charts. These tools play a vital role in transforming complex data into understandable stories. Their importance lies in presenting information in an accessible way, beyond just aesthetics. It’s about effectively communicating insights derived from refined data. Self-service analytics have further enhanced this process, allowing users to actively engage with and derive meaning from the presented information. This enables individuals to navigate and interpret data independently, fostering a more dynamic and responsive analytical environment. The focus is on the actionable utility of information, where clean, modeled data and intuitive reporting tools contribute to a seamless and impactful storytelling experience within the realm of analytics.
In conclusion, a modern analytics journey is not just about using fancy tools or advanced models. It’s about building a streamlined pipeline that delivers the right insights at the right time to empower your business growth.
For data-heavy industries like gaming, navigating complex operations, making timely decisions, managing finances, and handling promotions can feel daunting. Investing in a robust analytical setup, such as a data warehouse and visualization tools, can boost your operations and act as a compass for business growth.
Empowering your analytics journey doesn’t have to be a solo endeavor. At Vindiata, we are experts in crafting and implementing seamless analytical pipelines, from data ingestion to insightful visualizations. Our experienced team leverages the latest technologies and best practices to build high-performance, scalable, and cost-effective modern analytics stacks tailored to your unique needs. Whether you’re navigating a complex data landscape or starting your insights adventure, Vindiata is your trusted partner, ensuring you arrive at data-driven decisions with confidence.